We Tried to Predict Nine Years of NFL Stardom From One Rookie Season. Three Positions Let Us.
One rookie season, nine years of consequences. A four-position study of every rookie class since 2000 - by Glenn Dalbey - finds the career signal at WR, RB and QB, a sleeper tell on special teams, and one position where honest math refuses to answer.

Week 1 Muscle Reports: The Cost Shows Up in Missed Appearances
A rebuilt 2014–2025 study using game-level snap counts finds roughly one fewer appearance and a front-loaded scoring cost after a Week 1 muscle or tendon report.

De'Von Achane's $68M Extension Locked the Workload. Miami's Win Total Will Try to Steal It
Achane signed 4yr/$68M to lock the Miami bell-cow workload. But the Dolphins also project to 4.5 wins — the lowest in the league. Game scripts will fight the carries.
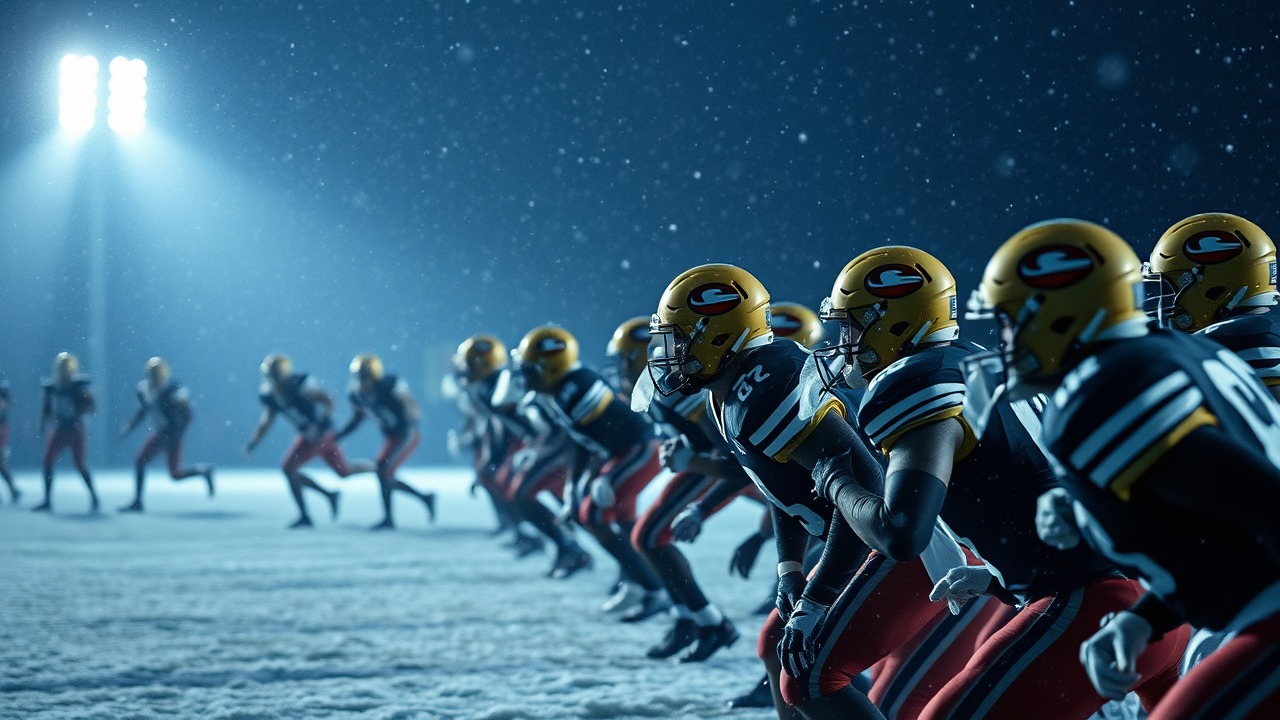
Read the Wind: 2026 Outdoor Games to Fade in October
The Setup: Why October Wind Is the Quiet Slate-Killer Most fantasy managers think wind is a December problem. The data says October is where the wind cliff actually starts, and the early-season fade l...
Jonathan Taylor Is a Workload Problem, Not Empty Calories
The old two-model article got the verdict backward. ScrimmageLab's empty-calories file gives Jonathan Taylor a 22.9 score, below the RB average of 27.7, while the fatigue file still flags a real workload risk.
The 213-Carry Cliff Is a Warning Light for Fantasy Running Backs
The running back fatigue signal in ScrimmageLab's 2025 file does not say every back falls apart at carry 213. It says the warning light starts there. Across 552 qualifying player seasons, the RB carry curve drops from 4.68 average YPC…
Stay in the loop
Get the latest analyses, model updates, and fantasy insights delivered to your inbox. No spam — just data.